A short story about how to create your first Intellij IDEA plugin.
How it started
I was at Spring I/O 2026 in Barcelona and during a break, I ended up in a conversation with a JetBrains representative who was demoing one of their new plugins — I believe it was a Spring debugger integration. I’d been using IntelliJ for years, but I’d never really looked into what it takes to build a plugin for it. That conversation sparked a curiosity that followed me home. I decided to dive in and create a plugin myself.
The idea came from a colleague at work. He had built a Gradle plugin that collected test execution data and generated a Gantt chart using the Mermaid library. It was genuinely handy for visualizing whether your tests were actually running in parallel or queuing up one by one.
I decided to take that concept and bring it natively into IntelliJ — as a proper IDE plugin, with full UI integration, no external tooling required. My target was:
- Build systems: Gradle and Maven
- Test frameworks: JUnit 5, Kotest, Spock 2.x, TestNG
So I did it, it took couple of weeks. IntelliJ’s plugin development documentation is very helpful and contains huge amount of informations. Including a lot of examples, how to create tests, even best development practices and publishing guide to Jetbrains Marketplece.
How it works
The plugin integrates into IntelliJ at several levels:
Context menu — A “Tests Analyzer” group appears when you right-click a test directory or file in the Project View. Two actions are available: Run and Analyze (executes tests and shows results) and Analyze from Existing Execution (reads previously saved results without re-running).

Test execution — For Gradle projects, the plugin uses IntelliJ’s RunConfiguration API to trigger tests natively, so you get the same progress display you’re used to. For Maven, it runs mvn test and parses the Surefire/Failsafe XML reports.
Result collection — The core of the plugin is built around SMTestRunnerEventsListener, an IntelliJ extension point that hooks into the test runner lifecycle. Every test start and finish event is captured with timestamps, which is what makes the timeline possible.
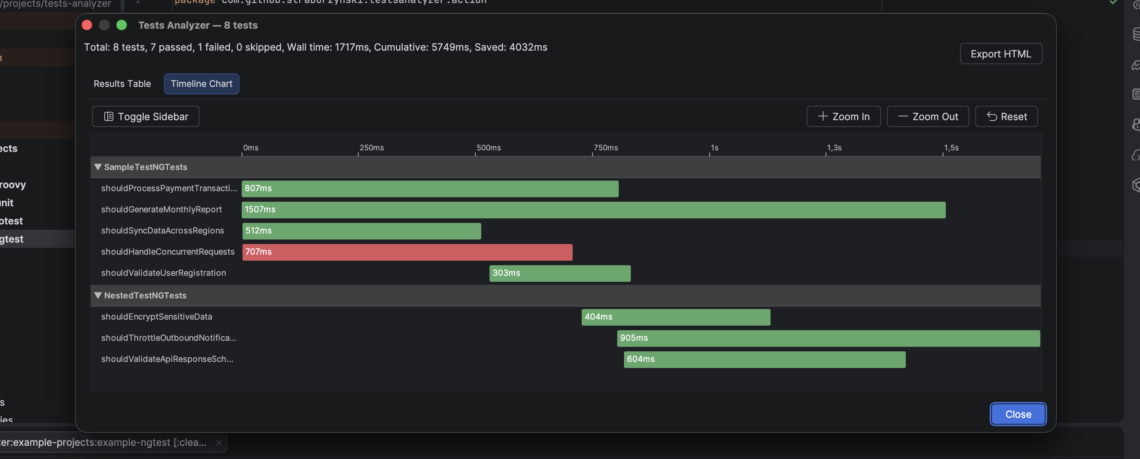
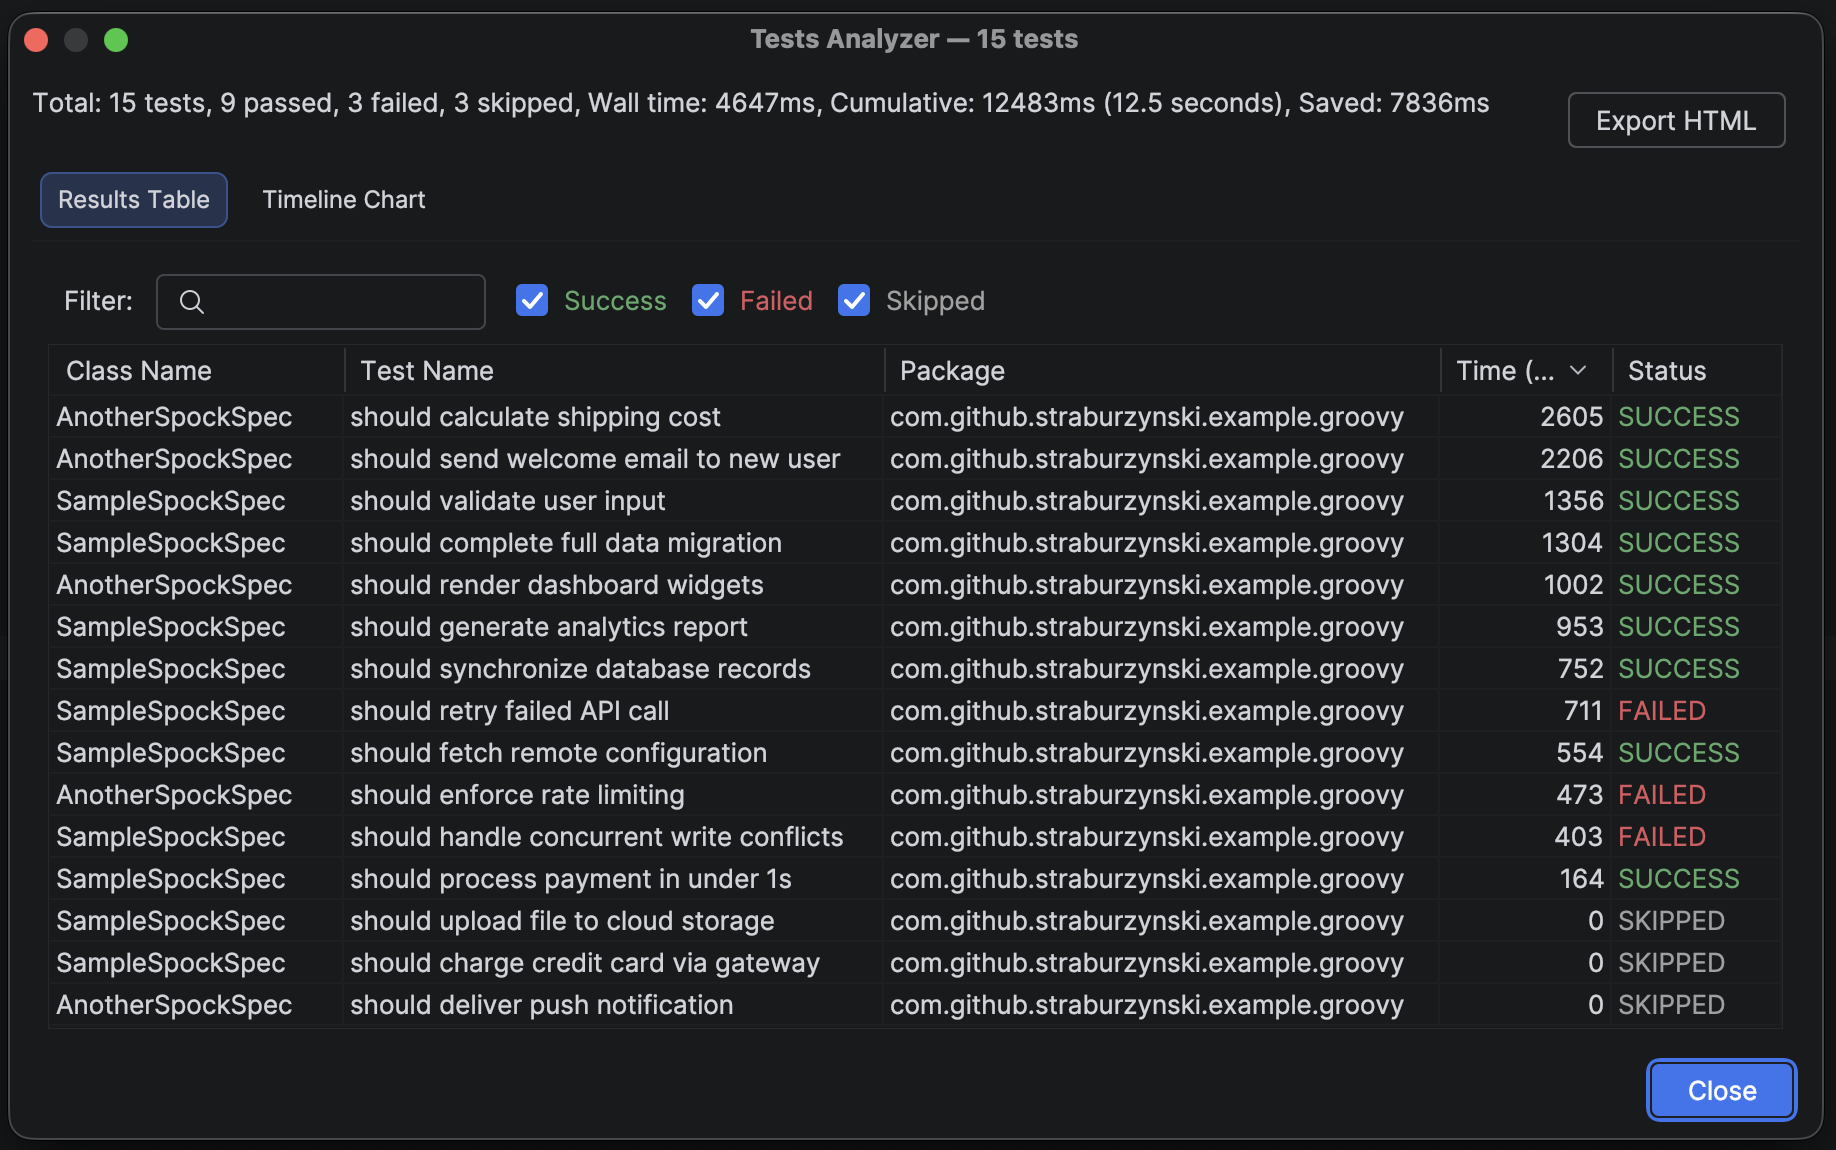
Results window — Once tests finish, a dialog opens with two tabs:
- A sortable, filterable Results Table with test name, class, duration, and status
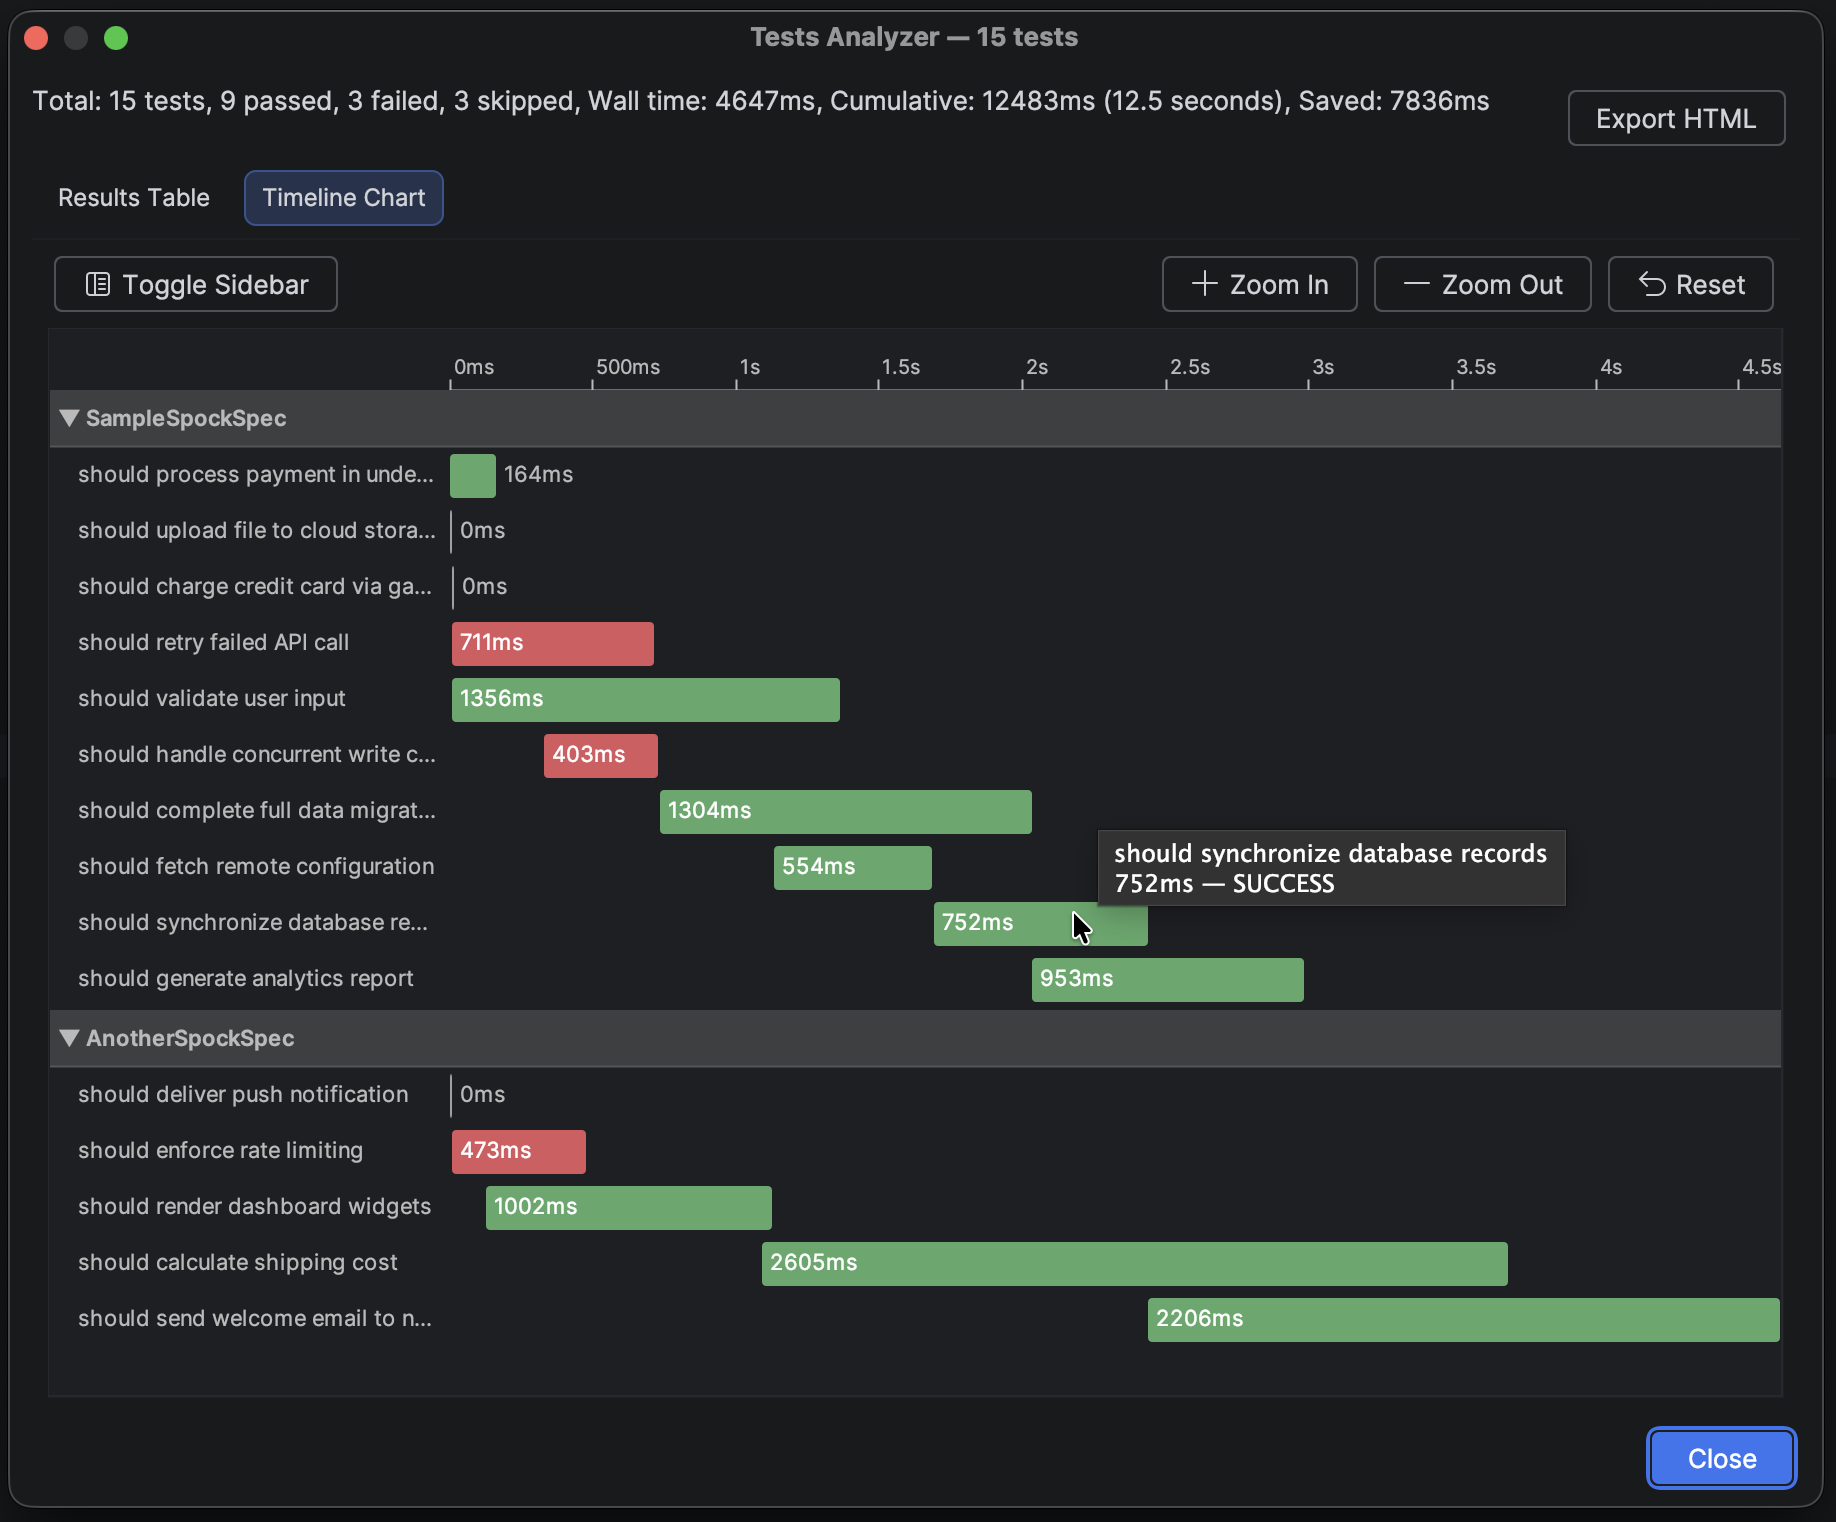
- A Timeline Chart — a Gantt-style chart showing which tests ran in parallel and where the bottlenecks are
HTML export — Results can be exported as a fully self-contained HTML file with an embedded SVG chart — handy for sharing or archiving.
Results are also persisted as JSON to build/reports/tests-analyzer/, which enables the “Analyze from Existing Execution” action.
What’s it for
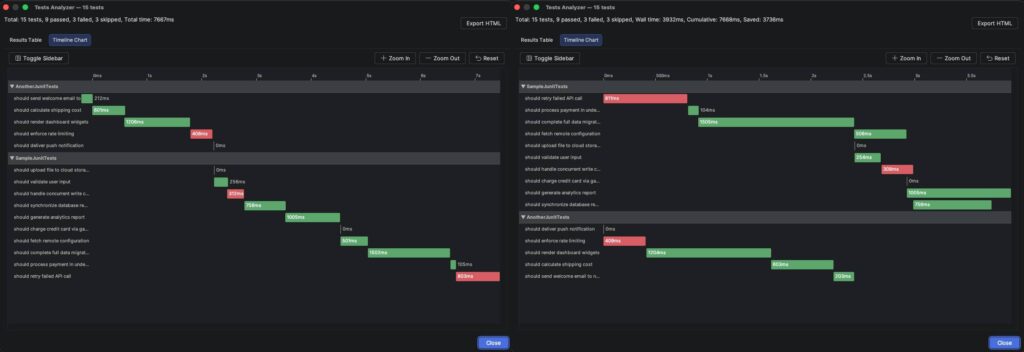
I use the plugin to analyze test durations, especially in scenarios where I convert single-threaded tests to parallel ones. This example best illustrates the differences.
Plugin also calculates:
- Wall time – elapsed real time from the first test start to the last test finish (includes parallel execution)
- Cumulative time – sum of all individual test durations (as if tests ran sequentially)
- Saved time – time saved by running tests in parallel (cumulative minus all time)
How it ended
I did it. It took a couple of weeks. Exploring the IntelliJ plugin ecosystem was genuinely fun. It’s not easy to start, there is definitely some learning curve, but IntelliJ Platform SDK is well documented and has a lot of useful examples.
I’ve already been using Tests Analyzer in my day-to-day work, and it’s proven useful for tuning parallel tests execution. The Gantt chart makes it immediately obvious when parallelism isn’t working as expected — you can tweak thread pool settings or test grouping, re-run, and see the impact right away.
If you work with Java or Kotlin projects in IntelliJ and care about test suite performance, give it a try.
- JetBrains Marketplace: Tests Analyzer
- Source code: github.com/straburzynski/tests-analyzer